geneticMapR is an R package designed to simplify the
construction of genetic maps and QTL analysis using molecular markers in
F2 bi-parental populations.
Genetic map construction is often overlooked in the genetic mapping literature and can be time-consuming. This package aims to make the process reproducible and to provide tools for QTL visualization and plant genetic research.
Functions in geneticMapR and key mapping steps will be
illustrated using a real dataset from Beta vulgaris (table
beet), an outcrossing species. The F2 population was derived
from crosses between Cylindrical × Round (inbred) lines, representing
distinct root shapes. The challenges posed by the outcrossing nature of
Beta vulgaris will help highlight practical solutions for
common problems in genetic mapping.
My early genetic maps were difficult to reproduce and prone to
mistakes. I hope geneticMapR supports your journey toward
reliable and reproducible genetic maps.
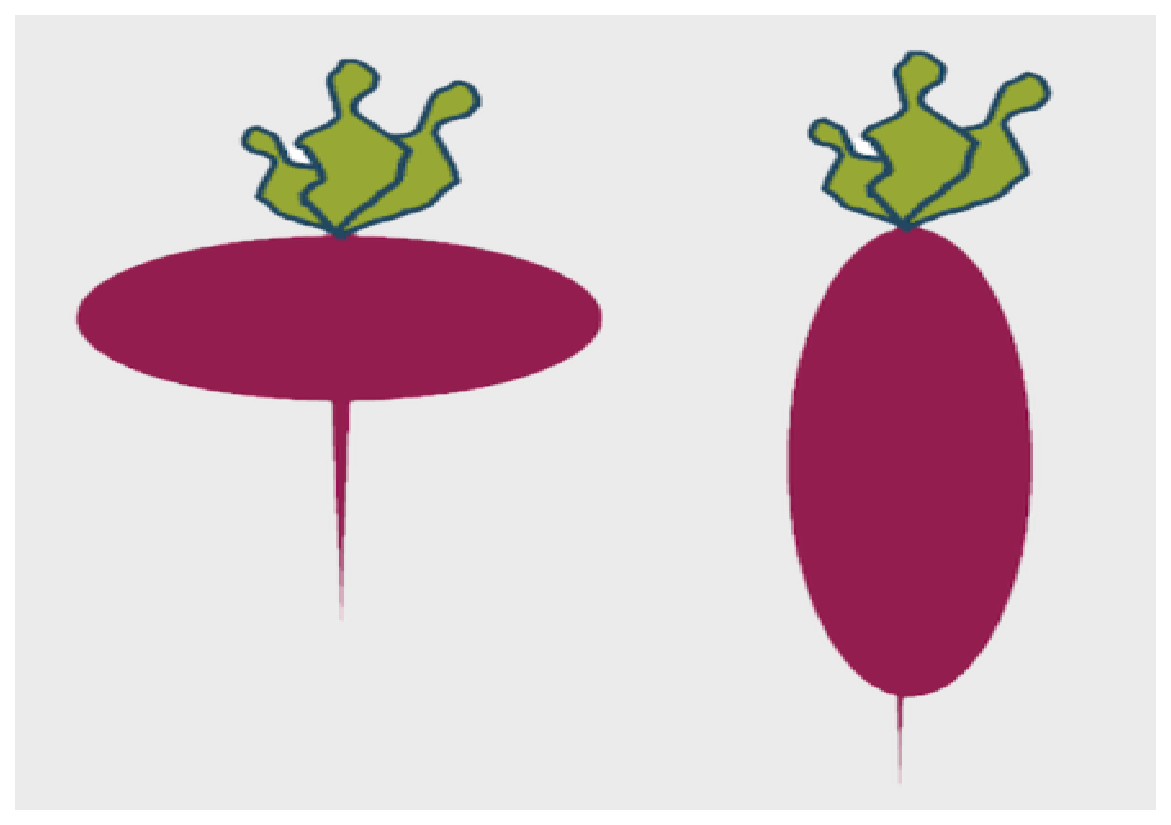
Flat x Cylindrical table beet cross. Image credit. Dr. Maddy Oravec
Installation
# Get devtools if needed
if (!requireNamespace("devtools", quietly = TRUE)) {
  install.packages("devtools")
}

#Install geneticMapR
devtools::install_github("vegaalfaro/geneticMapR")
Recommendations
When genotyping, it is critical to include DNA from the parental lines and the F1 individuals. Ideally, this should be from the actual plants used to create the population, especially in outcrossing species like carrot or beet.
If tissue from the original parents or F1 is unavailable, use samples from other plants of the same genotype. However, in outcrossing species, even inbred lines may show unexpected intra-genotype diversity. I’ve seen this firsthand in carrots.
Parental genotypes are essential for recoding or phasing markers to reflect parental inheritance, a core step in genetic mapping. They’re also helpful for resolving problematic markers and understanding residual heterozygosity, which is common in many populations.
Having the parents and F1 genotyped will prove invaluable for a genetic mapping project.
Using Your Own Data
Ther purpose of this package is for you to use your own data. You can
use your own genotype matrix with geneticMapR. Functions
like convert_to_dosage() and
convert_to_dosage_flex() help format raw genotype calls
into phased numeric values compatible with the package.
For unfiltered VCF-derived matrices, make sure to:
- Filter for bi-allelic SNPs.
- Remove non-polymorphic markers.
- Keep only SNPs with sufficient depth and genotype quality scores, it varies for each project or population.
If you need help in this pre-mapping step, check the
bcftools_tutorial in my github vegaalfaro/bcftoolsR.
Still under development.
Where to start?
geneticMapR helps you construct genetic maps in
F2 mapping populations. While it is primarily designed for
diploid species, some functions also support polyploids.
To get started, you’ll need a few essential files:
Genotype file: A matrix where individuals are scored for their genotype across multiple loci in the genome.
Phenotype file: One or more traits measured across individuals, possibly across time or environments (multi-environment trials), depending on your species.
geneticMapR provides example data to walk you through
the mapping process. We’ll start with an example VCF[https://samtools.github.io/hts-specs/VCFv4.2.pdf] file
which is the typical output of next generation sequencing platforms like
genotyping by sequencing (GBS)